
2026 Mid-Year Review
Cycle V Begins, Path Remains Jagged
While economic headlines remain uncertain, improving property fundamentals, demographic demand and limited new supply continue to support a new cycle of opportunity in commercial real estate.

Executive Summary
Current data support our long-term outlook even as geopolitical events and new tariffs create short-term volatility. Business investment in Artificial Intelligence (AI) remains the primary engine for Gross Domestic Product (GDP) growth, effectively offsetting a cooling labor market and slower job creation. While the Federal Reserve (the Fed) has paused its anticipated rate cuts due to temporary energy and trade-related price spikes, the underlying demographic trend points toward structural disinflation. The ongoing contraction in new construction starts is further solidifying a supply scarcity that will define the market for several years. We expect income to remain the primary driver of returns as the market adjusts to a stable interest rate environment. We believe this transition period offers a compelling entry point into what we expect to be a strong upcoming vintage.
Macroeconomic Highlights
-
AI capital spending drove roughly 40% of real GDP growth over the last five quarters, with business investment rising 10.1% in Q1.
-
Structural forces such as aging populations and high debt levels remain entact anchoring long-term inflation and lending rates, as seen in Japan’s recent dip to 1.5% inflation.
-
The Federal Reserve, under new Chair Kevin Warsh, is expected to raise rates 25 bps following May’s inflation reading of 4.2%.
-
Geopolitical tensions and new tariffs have pushed the 10-year Treasury near 4.5% while reducing real wages and consumer discretionary spending power.
-
Job growth has cooled to near replacement level, as the three-month pace fell to 111,000, displaying an economy led by productivity, not headcount.
Commercial Real Estate Highlights
-
Q1 transaction volume increased 21% year-over-year, marking the eighth consecutive quarter of growth in trailing 12-month volume.
-
Multifamily starts fell 76% from their 2022 peak to the lowest level since 2011, signaling an impending supply shortage that could drive rent growth in 2026 and 2027.
-
Income accounted for 93% of total returns in Q1, as rising interest rates have shifted the focus away from cap rate compression as the value driver.
-
Senior housing occupancy is nearing 90% and medical outpatient investment rose 72% year-over-year, supported by aging baby boomers.
-
Self-storage occupancy rose to 89% and residential renewal rents are now outpacing new-lease asking prices, indicating a stabilization in sector fundamentals.
scroll_next
A New Cycle: 2026 Mid-Year Thesis Update
Held
-
GDP growth continues to be driven by productivity. AI CapEx is still doing the heavy lifting, with Q1 business investment up 10.1%, the fastest in nearly three years.1
-
Aging demographics remain the dominant long-term force. Japan continues to illustrate how an aging population often softens inflation, as the country’s inflation has fallen to 1.5% despite years of efforts to reach its 2.0% target.2
-
Cap rate compression is unlikely to be the primary return driver this cycle. Cap rates have drifted slightly higher as rising rates and and a capital slowdown have put upward pressure on them.3
-
Q1 GDP landed within our January range, but the composition was noisy: tariff front-running and a post-shutdown Q4 rebound distorted the top-line number, leaving underlying demand roughly in line with our forecast.4
- The capital scarcity risk we flagged in January has shown up sooner than expected, with geopolitical tensions pushing term premiums higher rather than fiscal crowding out.5
- An elevated inflation pulse from the Iran conflict and tariffs has pushed the Fed off the rate-cut path we anticipated.6
- Q1 GDP came in within our January outlook range, but the quarter was noisier than expected, with tariff front-running and a rebound from the shutdown-disrupted Q4 affecting the headline.7
Forecasts vs Actuals8
| Metric | January Forecast for 2026 | Mid-Year Actual |
| Real GDP Growth | 1.5% - 2.0% | 1.6% |
| 10-Year Treasury | 4.0% - 4.5% | 4.5% |
| Fed Funds Rate | Declining (rate cuts) | Stable (no cuts or hikes) |
| Unemployment Rate | < 5.0% | 4.2% |
| CPI Year-Over-Year | ~ 2.0% | 4.2% |
scroll_next
Macro Update: Bumpy Short-Term, Same Long-Term
Inflation
The Iran Shock and Tariff Pass-Through
The late-February U.S.-Israeli conflict with Iran sent energy prices higher, resulting in a 40 percent year-to-date jump in gasoline.9 The May Consumer Price Index (CPI) rose to 4.2 percent, the highest since 2023, with core CPI at 2.9 percent,10 while the May Producer Price Index (PPI) rose 1.1 percent month-over-month, the biggest jump since 2022.11 Real average hourly earnings turned negative year-over-year for the first time since 2023, falling 0.7% in May.12
Commodity-driven inflation pulses are not the same as the structural inflation that comes with an aggressive expansion of the money supply. However, such shocks act as a tax on households, compressing real incomes, reducing discretionary spending, and ultimately suppressing demand.13 This type of shock, which pulls spending power out of the consumer’s pocket, is unlikely to build a durable price spiral, and instead points to lower inflation pressure.
Potential Risk: Consumer Sentiment and Inflation Expectations
Consumer sentiment has been heavily depressed since the onset of the pandemic and hit its lowest point ever in May.14 No single factor explains the post-2021 disconnect between weak sentiment and resilient hard data. However, leading academic explanations include borrowing costs that fall outside official inflation measures, the cumulative price-level effect of a 29 percent rise in CPI since January 2020, and asymmetric partisan response patterns.15 Additionally, changes in survey methodology, most notably the University of Michigan’s 2024 shift from phone to online data collection, may also be contributing to weaker sentiment readings.16
More consequentially, one-year inflation expectations have risen to 4.8 percent and long-run expectations (five year) to 3.9 percent, compared to a 2015 through 2019 average of 2.6 and 2.5, respectively.14 When long-run inflation expectations un-anchor, they historically feed into wage-setting and lease pricing. A continuation of this trend could further alter the short-term inflation and interest rate outlook, pushing both higher in the near-term.
Demographic-Driven Markets
An aging population, large debt loads, and an active central bank typically point to structural disinflation as the economy struggles to expand. Japan’s CPI just hit a four-year low at 1.4 percent in April and rising slightly to 1.5% in May, amidst rate hikes over the last two years.17 Additionally, the Bank of Japan has cut its forecast for fiscal 2026 growth to 0.5 percent, down from 1.0 percent.18 China may face a similar disinflationary environment as weak domestic demand, high debt, and a declining labor force support the demographic thesis, with any near-term inflation likely driven by energy price volatility rather than underlying demand.19
Japan Inflation vs Population Growth17
Productivity vs. Employment: Productivity Still Carrying the Load
Q1 business investment rose 10.1 percent, driven by AI data-center spending, while hiring has slowed to near replacement level, June payrolls rose just 57,000, prior months were revised down 74,000, and the three-month pace has fallen to 111,000, versus roughly 300,000 a month early in the decade.20 The AI capex contribution to GDP remains the dominant growth story; we estimate that tech capital spending has driven approximately 40 percent of real GDP growth over the last five quarters on average.21 This is broadly consistent with the slower-employment, productivity-led backdrop we outlined in January.
Tech CapEx Contibution to Real GDP Growth21
Interest Rates: Top of the Range, Not Breaking Out
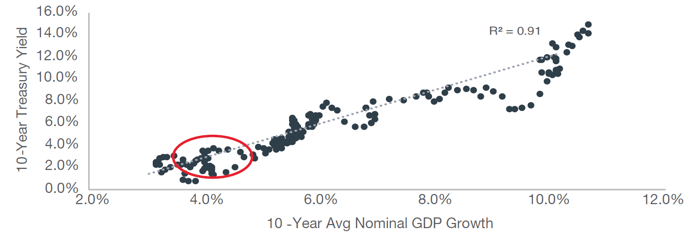
The 10-year U.S. Treasury has risen approximately 30 basis points year-to-date and sits near 4.5 percent, right at the top of our forecasted ceiling.22 The newly confirmed Fed Chair, Kevin Warsh, assumed office in May amid a complex backdrop, with the Fed expected to refrain from cutting as markets price in a 25 basis point rate hike by year-end.23 Our base case update: the short end remains higher for longer than the market expected in January, and the long end drifts in a 4.0 to 4.7 percent band.
10-Year Treasury vs. 10-Year NGDP Growth22
Higher for Longer — Not Higher Forever
Demographics and debt still anchor our long-term outlook, despite the Iran conflict and tariff pass-through acting as exogenous shocks to the system rather than dramatic regime changes.
scroll_next
Commercial Real Estate Cycle V Confirmed
Based on our view that valuations bottomed in 2025, commercial real estate appears to be transitioning into a new cycle, with values showing early signs of stabilization. Sector fundamentals remain resilient, as the recent supply wave begins to fade.
Capital Markets and Transactions
-
Q1 transaction volume was up 21% year-over-year, marking eight consecutive quarters of trailing 12-month transaction volume growth.24
-
$400 billion in global dry powder, down from the peak of $440 billion in 2023.25
-
Cap rates are flat to slightly higher, with spreads to the 10-year Treasury still historically tight.26
-
Income returns continue to be the primary driver of returns accounting for 93% of total returns in Q1, we expect this dynamic to continue playing out.27
Transaction Volume28
The Supply Setup: Continuing to Improve
-
Q1 multifamily starts totaled 38,000 units, the lowest level since 2011 and down 76% from the early-2022 peak.29 The pipeline has also contracted to roughly 552,000 units under construction, down 50% from the early-2023 peak.30
-
Multifamily completions are also rolling over, down about 35% from a year ago as the 2024 delivery wave clears.31
-
Trailing 12-month starts for office, retail, and industrial are down -60%, -22%, and -50% respectively.32
-
Senior housing under construction is at its lowest level since 2012.33
Upward pressure on rates and construction costs continues to drive the gap between replacement cost and asset values, digging an even deeper hole in the pipeline. When demand recovers, the paucity of new supply will likely lag the increases in demand, at least for a 24-to-36 month window, setting up commercial real estate for strong rent and occupancy gains as well as increasing returns.
Starts as a % of Stock34
scroll_next
Sector Update
Residential / Multifamily35
-
Vacancy is at 5.1%, with net absorption exceeding completions for the first time in three quarters.
-
Renewal conversions are approaching the highs seen during 2022, as renewal rents are outpacing new-lease asking rents, making blended growth healthier.36
-
Ongoing decline in the pipeline will likely lead to high-supply Sun Belt markets clearing the supply overhang by the second half of 2026 or early 2027.
-
The build-to-rent thesis remains intact, with the sector positioned as a highly sought-after property type, boosted by the persistent affordability gap between renting and owning and its broad appeal to both millennials and baby boomers.
Self-Storage
-
Fundamentals are showing early signs of stabilization.
-
Public REIT average occupancy rose in Q1 to 89%, up 20 basis points year-over-year.37
-
Rents were essentially flat in Q1 after years of declines. Rents have begun turning positive in some markets and are expected to turn positive in most markets by year-end.38
-
With new supply staying constrained, the 2027 setup looks strong.
Medical Outpatient Buildings
-
Q1 MOB investment rose 72% year-over-year, the highest since Q2 2023.39
-
Cap rates compressed to 6.9% in Q1, with rents at record highs.40
-
The last two quarters have shown a normalization of capital flows, with transaction volume returning to pandemic ranges.
Senior Housing
-
Q1 occupancy was 89.5%, up 40 basis points quarter-over-quarter, likely to cross 90% in 2026.41
-
Rent growth continues to accelerate, now above 4.0% annually.42
-
Construction is at its lowest level since 2012.43
-
Strongest demographic story across commercial real estate, as the “boomer-turns-80” wave is underway.
What to Watch in H2 2026: Three Big Questions
-
Does the Iran-driven inflation pulse fade or stick? If the next few months see a cooling core CPI, the Fed may have enough cover to cut rates by year-end. Otherwise, a higher-for-longer regime is likely to persist through 2027.
-
Does AI CapEx hold up, and do AI-driven productivity gains begin to materialize across companies? Any sign of an AI CapEx air pocket could materially impact GDP growth.
-
Does capital scarcity become binding? Government deficits continue to escalate, as private spending marches on, driven, in part, by AI, reshoring, and domestic manufacturing. If capital becomes scarcer, borrowing costs and return hurdles may remain elevated.
scroll_next
Bottom Line
Though headlines have shifted since January, our long-term thesis has not. The drivers remain intact: productivity carries growth, demographics fuel sector demand, construction pipelines have collapsed, and incomes drive returns. The short-term noise from Iran, tariffs, Fed dithering, and a new Chair creates entry-point opportunities for those willing to look past the next two CPI prints.
Our highest conviction sectors at the start of the year, multifamily and build-to-rent, self-storage, medical outpatient buildings, and senior housing, all reported mid-year results that strengthen the case. We believe fundamentals are improving as new supply falls and demand recovers driven in large part by underlying demographic tailwinds which are now showing up materially in the data.
We do not believe this next cycle will be defined by cap-rate compression and cheap leverage. It is likely to be shaped by rising incomes, demographic tailwinds, and a scarcity of new supply, a combination that rewards patient capital deployed near the bottom. We believe that entry window is open now.
scroll_next
1 U.S. Bureau of Economic Analysis Q1 2026 Nonresidential Fixed Investment
2 Statistics Bureau of Japan, April 2026
3 Fred: DGS10
4 CoStar Starts
5 Federal Reserve: Financial Stability Report, May 2026
6 Fred: CPI, FOMC March 2026 Minutes
7 U.S. BEA GDP, Q1 2026 & Q4 GDP: Acceleration vs Q4 reflected upturns in government spending and exports and stronger investment; imports also turned up
8 Fred: GDPC1, DGS10, FEDFUNDS, UNRATE, CPIAUCSL
9 Fred: CPILFESL, CPIAUCSL, CUUR0000SETB01
10 U.S. BLS CPI, April 2026
11 Fred: PPIFID
12 U.S. BLS: Real average hourly earnings, April 2026
13 Barnichon, Régis, and Aayush Singh, “What Is a Tariff Shock? Insights from 150 Years of Tariff Policy,” Federal Reserve Bank of San Francisco Working Paper 2025-26, November 13, 2025
14 University of Michigan, Surveys of Consumers; Conference Board’s Consumer Confidence Index is reflecting a similar pattern, May 2026
15 Bolhuis, Cramer, Schulz, Summers, “The Cost of Money is Part of the Cost of Living,” NBER WP 32163, 2024; Cummings & Mahoney, “Asymmetric Amplification and the Consumer Sentiment Gap,” Briefing Book, 2023.
16 Cummings & Tedeschi (2024); Milken Institute Review, May 2025.
17 Statistics Bureau of Japan, and Bank of Japan Monetary Policy; Census.gov international database, and Stats.go.jp
18 Bank of Japan, Outlook for Economic Activity and Prices, April 28, 2026
19 https://www.imf.org/en/news/articles/2026/02/18/pr-26053-china-imf-executive-board-concludes-2025-article-iv-consultation
20 U.S. Bureau of Economic Analysis, Q1 2026 & https://www.bls.gov/news.release/empsit.nr0.htm
21 Bea.gov GDP Expanded Detail & Census.gov construction spending, YoY
22 Federal Reserve H.15; Fred: DSG10, GDP
23 CME Group Fed Watch Tool
24 CoStar
25 Pitchbook Q1 2026 Global Private Market Fundraising Report, Data as of September 2025
26 Fred DSG10, NCREIF Appraisal Cap Rates, Green Street Nominal Cap Rates
27 NCREIF NPI Returns
28 CoStar
29 RealPage
30 RealPage
31 RealPage
32 CoStar – Trailing 12-month Starts
33 NIC MAP Data
34 RealPage
35 RealPage
36 RealPage
37 Green Street Self-Storage Sector update, same-store occupancy, Q1 2026).
38 Green Street
39 https://revistamed.com/more-mob-sales-in-2026/
40 CBRE U.S. Medical Outpatient Building, Q1 2026
41 NIC MAP, Q1 2026
42 NIC MAP, Q1 2026
43 NIC MAP, Q1 2026
scroll_next
2026 Mid-Year Review