
Healthcare Sector Review

Executive Summary
Healthcare real estate is entering a period of durable secular growth driven by one of the most powerful demographic shifts in modern history. The oldest baby boomers began to turn 80 in 2026, and with that comes increased healthcare utilization and senior housing demand. Healthcare demand is largely non-discretionary, supported by aging demographics and rising healthcare expenditures. At the same time, older households control a substantial share of U.S. wealth, providing the financial capacity to convert demographic demand into actual spending on healthcare services, outpatient care, and private-pay senior housing.
In this report, we focus on medical outpatient buildings (MOBs) and private-pay senior housing. Both sectors are experiencing increasing demand while new supply remains constrained due to elevated construction costs, financing challenges, and lengthy development timelines. For MOBs, the long-term shift from inpatient to outpatient care continues to drive occupancy, rent growth, and investor demand. For senior housing, record-low construction activity is colliding with accelerating resident demand at a time when occupancy, rents, operating margins, and capital flows are all improving. The result is a favorable supply/demand backdrop that should support above-average net operating income (NOI) growth, attractive income returns, and potential appreciation as fundamentals continue to strengthen.
Healthcare Highlights
-
The 80-plus population is growing rapidly. Nearly 10,000 Americans are expected to turn 80 each day over the next decade, supporting sustained demand growth across healthcare real estate.
-
New supply across both subsectors remains near multi-decade lows, creating a favorable long-term supply/demand backdrop that we believe supports continued performance.
-
MOB occupancy and asking rents reached record highs in late 2025 and early 2026, and institutional capital has begun returning to the sector.
-
Senior housing occupancy is approaching 90%, with operating margins back above pre-pandemic levels.
-
Private-pay senior housing sits outside the Medicaid funding pressures now facing skilled nursing, insulating it from significant policy risk.
scroll_next
A Demographic Inflection Point
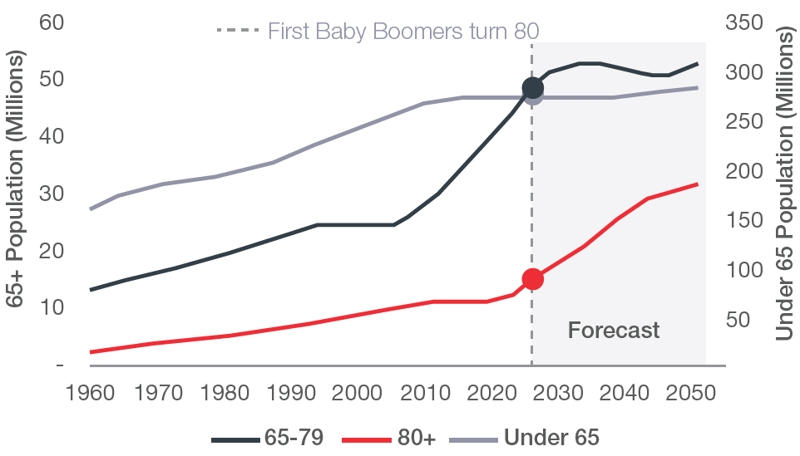
The United States is experiencing a demographic transition that is reshaping healthcare demand. The country is not only older than it has ever been, but its oldest cohorts are now growing the fastest. The once-projected “silver tsunami” has officially begun, with 2026 marking the first year that baby boomers began turning 80. By 2030, an estimated 73 million Americans will be 65 or older, representing 20.0 percent of the population.1 The senior population (80-plus) is expected to grow by more than 55.0 percent over the next ten years, with nearly 10,000 Americans turning 80 every day.1 We believe that healthcare utilization, chronic condition prevalence, and senior housing entry rates increase at this age. Unlike cyclical drivers, this demand is built on non-discretionary spending and depends less on economic conditions, making it a durable foundation for healthcare real estate.
Population Breakdown1
Healthcare Spending Rises with Age
Healthcare demand is highly age-driven as utilization rates surge with age. Americans 65 and older make up 17.0 percent of the population but account for 37.0 percent of all personal healthcare spending.2
Annual Healthcare Spend by Age2
As this cohort continues growing, demand for healthcare-related real estate is expected to grow alongside it. National health expenditures reached $5.3 trillion in 2024, roughly 18.0 percent of Gross Domestic Product (GDP),3 and the Centers for Medicare & Medicaid Services (CMS) projects that this share will climb to 20.6 percent by 2034, driven in large part by an aging population.4
Healthcare Expenditures as a % of GDP3
Boomers Have the Means to Pay
Demographic demand is only realized where there is purchasing power. Older households hold a substantial share of national wealth, with baby boomers and prior generations controlling 63.0 percent.5 That wealth supports out-of-pocket spending on senior housing and high-end healthcare services.
Net Worth by Generation5
scroll_next
Our Strategic Focus
Healthcare real estate is a broad category. This report focuses on medical outpatient buildings (MOBs) and private-pay senior housing, including independent living, assisted living, and memory care.
We exclude skilled nursing facilities due to their reliance on government reimbursement and greater operational complexity. The One Big Beautiful Bill Act’s estimated $990 billion reduction in federal Medicaid spending over the next decade highlights the policy risk facing government-dependent operators.6 We also exclude active adult (55-plus) housing, which is driven primarily by lifestyle preferences and behaves more like conventional multifamily than healthcare real estate.
We believe that, within the healthcare sector, MOBs and private-pay senior housing reduces exposure to reimbursement risk while maintaining access to demographic and healthcare demand drivers.
scroll_next
Medical Outpatient Buildings
MOBs serve physician practices, surgery centers, imaging providers, laboratories, and other outpatient healthcare services. Their specialized buildouts and equipment-intensive environments create high switching costs for tenants, often translating into longer tenant tenure, lower turnover, and more stable cash flows.
The Shift to Outpatient Care Continues
Care continues to migrate from hospitals into lower-cost, more convenient outpatient settings, driven by advances in medical technology, evolving care models, and patient preference. Outpatient volumes are projected to grow 8.0 percent over the next five years, while inpatient volumes are expected to decline by 1.0 percent.7 Underscoring this trend, eight of the ten fastest-growing patient volume categories are outpatient services, led by endocrinology, psychiatry, and physical therapy.8 This shift toward outpatient care is occurring alongside provider consolidation, as the share of physicians in independent private practice has fallen from 60.0 percent in 2012 to 42.0 percent today, with physicians increasingly moving into health systems and private-equity-backed groups that are better positioned to scale outpatient delivery.9
Hospital margin pressure is an additional driver of the outpatient shift. Operating margins have run in the low single digits for most hospitals over the past decade and closed 2025 near 1.3 percent, leaving little cushion against rising labor costs and an eroding payer mix.10 As inpatient care carries higher fixed overhead, the same procedure is much more profitable in an outpatient setting, pushing systems to move volume toward outpatient buildings. This shift is visible in employment trends, with outpatient care centers growing significantly faster than hospitals and the broader economy.11
Employment Trailing 10-Year Compound Annual Growth Rate11
Diversified Demand
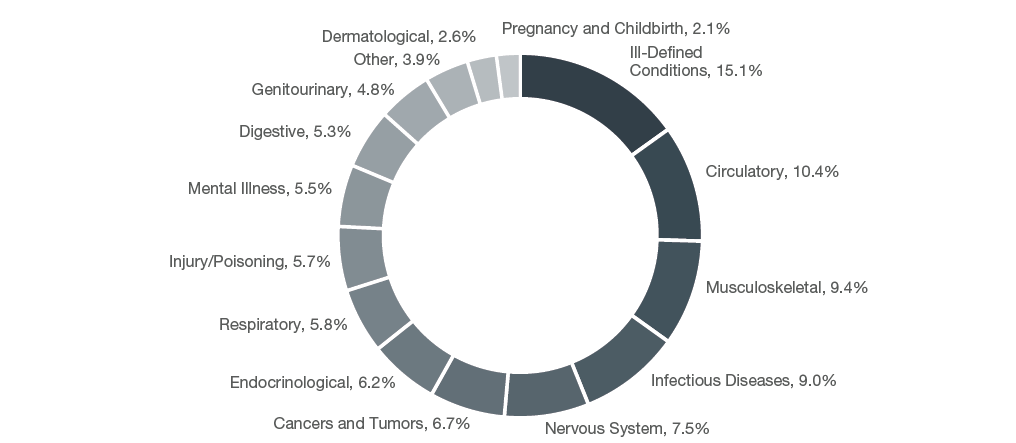
Medical services expenditures are distributed across a wide range of conditions, highlighting the depth and breadth of healthcare demand in the United States. Major areas of expenditure include circulatory conditions, musculoskeletal disorders, infectious diseases, nervous system conditions, and cancers and tumors. The broad allocation of spending demonstrates that healthcare utilization is driven by numerous chronic, acute, and age-related conditions rather than any single diagnosis. The diversification of medical service expenditure creates a demand base supported by a broad spectrum of specialties, services, and patient populations.
Medical Service Expenditure Distribution12
Construction at Decade Lows
As demand builds, new deliveries are slowing. As of 2025, MOB starts had fallen 30.0 percent since 2021, while completions displayed the same pattern on a lagged basis, reaching their lowest level since 2022.13 New development is constrained by construction and financing costs that make new projects hard to underwrite. Fitting out a basic outpatient building now averages $412 per square foot, pushing total construction costs above $600 per square foot, nearly double the average MOB sale price of $310 per square foot as of Q1 2026.14
MOB Starts22
Current development economics remain challenging. At prevailing construction costs and return requirements, a newly developed MOB would need to generate roughly $45 per square foot of NOI to achieve target returns, compared with approximately $19 per square foot for an existing asset acquired at current market pricing.15 In other words, new construction would need to produce more than twice the income of a comparable existing building to justify development. Until rents rise materially or construction costs decline, new supply is likely to remain limited.
Buy vs Build Economics15
| Metric | Buy (existing) | Build (new) |
| Cost Basis (per square foot) | $310.00 | $605.00 |
|
Return Target = Cap Rate + Development Spread |
6.0% = 6.0% + - | 7.5% = 6.0% + 1.5% |
| NOI PSF Required to Hit Target | $18.60 | $45.38 |
| Rent Multiple Required | 1.0x | 2.4x |
Record Occupancy and Rents
The supply/demand mismatch is showing up in MOB fundamentals with occupancy reaching a record 92.7 percent in the fourth quarter of 2025,16 while the sector also notched its fourth consecutive quarter of positive net absorption.17 MOB tenants are notably sticky as the cost and disruption of relocating imaging equipment, exam rooms, and specialized buildouts keep renewal rates high and give landlords pricing power that ordinary office space cannot match.
Rents continue to grow as asking rents climbed 3.3 percent year-over-year, continuing to reach new highs.18 Rents typically grow via two channels: (1) fixed annual escalators near 2.5 to 3.0 percent, with some leases tied to the Consumer Price Index, and (2) mark-to-market opportunities, which can be wide as some leases sit well below the asking rent that space would command on the open market. Combined with the low turnover described above, both channels may compound into rent growth that landlords can capture at renewal rather than through costly re-tenanting.
Completions vs. Absorption23
Capital Markets and Returns
Capital is returning to this sector, reflecting growing confidence in its long-term fundamentals. Transaction volumes have stabilized just above the 2015 through 2019 average.19 Pricing has also been relatively stable over the past five quarters, as average cap rates have hovered near 7.0 percent.20 With long leases, low tenant turnover, and demand tied more closely to demographics rather than broad economic cycles, MOBs should continue to experience NOI growth. Triple-net leases and modified-gross structures support NOI growth as rising operating expenses and higher tenant build-out costs are largely passed on to the tenant.
Transaction Volume24
Since 2011, total returns have averaged 7.8 percent with 2025 coming in at 5.7 percent, as appreciation for the year was flat. Q1 2026 saw the third consecutive quarter of positive appreciation, at 1.6 percent annualized, as total returns came in at 7.1 percent annualized.21
MOB Returns21
*Income return measures net operating income, or NOI generated from operations. Appreciation return is the change in properties value over time. Total return is the sum of both.
Favorable demographic trends, resilient occupancy, limited tenant mobility, and renewed institutional capital support our confidence in a constructive long-term outlook for the MOB sector.
scroll_next
Senior Housing
Senior housing spans a range of living arrangements built around the needs of older adults: independent living for relatively healthy seniors, assisted living for those who need help with daily activities, and memory care for those requiring specialized, consistent support. Each step up the spectrum brings higher acuity, higher cost, and an older average resident. Unlike most real estate sectors, senior housing pairs a physical building with a substantial service operation, making operator quality a critical determinant of long-term performance.
Independent living and assisted living represent the largest portions of the market, with approximately 760,000 and 745,000 units nationwide, respectively, while memory care accounts for roughly 270,000 units. Average monthly resident costs increase from approximately $3,800 in independent living to $6,100 in assisted living and $7,900 in memory care, reflecting the greater level of care provided. Higher care intensity also affects operating performance, with NOI margins averaging roughly 33.0 percent in independent living, 27.0 percent in assisted living, and 20.0 percent in memory care. Residents generally enter these communities in their mid-80s, while average lengths of stay decline from approximately 2.5 years in independent living to 1.5 years in memory care as healthcare needs become more acute.25
A Private-Pay Business
A defining characteristic of this segment is its predominantly private-pay revenue model. Residents largely fund care through personal savings, investments, home equity, or long-term care insurance. The vast majority of independent and assisted living residents pay out-of-pocket (97.0 percent) rather than through government programs or other sources (3.0 percent).25 The private-pay structure limits exposure to Medicaid reimbursement risk, making resident financial capacity and consumer preferences, particularly care quality, safety, and value, the key drivers of demand.
The private-pay model raises the question of affordability. Roughly 45.0 percent of households over 75 can cover senior housing costs from income alone (Social Security, pensions, investment income, and other retirement vehicles), up from 35.0 percent in 2018.25 Asset values provide an additional backstop as median net worth of the 75-plus population sits at $335,000.26 As a result, resident economics appear favorable today, supporting the sector’s ability to convert aging demographic demand into actual resident move-ins.
The Supply/Demand Mismatch
A persistent supply/demand imbalance continues to accelerate in 2026. New supply has collapsed as annual inventory growth slowed to 0.4 percent, the lowest since at least 2006.25 Construction also continues to slow, with units under construction as a percent of inventory declining to 2.3 percent, the lowest since the early 2010s.27 Compounding physical and economic factors make it highly unlikely that supply will respond quickly. High construction costs and elevated borrowing costs have limited project feasibility. Long development timelines also have an impact. On average, senior housing projects require 29 months from ground breaking to certificate of occupancy, while the full timeline from ideation through entitlement and development to stabilization can span five to seven years.28 This timeline exceeds that of most conventional multifamily developments, which averaged about 20 months from permit to completion in 2024.29
Construction Starts39
Consequently, even a meaningful increase in construction starts would take years to translate into new inventory. Supply will continue to chase demand through the next cycle as it is estimated that an additional 600,000 units will be needed by 2030 just to hold occupancy at 90.0 percent, more than twice the maximum development pace ever seen.30 As a result, demand is likely to exceed the industry’s capacity to deliver new inventory for years to come.
Anticipated New Units Needed to Maintain 90% Occupancy30
Fundamentals
Senior housing fundamentals are reflecting this supply/demand imbalance, as the demographic story is leading to real operational gains. Occupancy reached 89.9 percent in Q2 2026, the 20th consecutive quarter of gains and the highest level since before the pandemic.30 The National Investment Center for Seniors Housing & Care (NIC) projects occupancy will cross 90.0 percent in 2026 and continue climbing in the coming years. Rents continue to rise, having grown annually at or above 4.0 percent since 2022, now up 4.4 percent for independent living and 4.9 percent for assisted living year-over-year in Q2 2026. Forecasts show continued upside in rents and occupancy as rents are expected to grow near the 4.0 percent annually through the end of the decade, and occupancies are anticipated to rise to roughly 95.0 percent.31
Completions vs. Absorption39
Key Margin Risk: Labor remains a key risk as it accounts for 55.0 percent of operating costs and is the primary determinant of margin.32 Wage growth has run above inflation, with assisted-living wages up 7.6 percent in 2024 and 3.0 percent in 2025.33 Despite this, operating performance continues to improve, with margins climbing above 35.0 percent in Q1 2026, the highest since 2020.34
Capital Markets and Returns
Investment activity has accelerated. Transaction volume reached roughly $27 billion in 2025, one of the strongest years on record for this sector.35 Unlike most major property types, senior housing did not experience an immediate post-pandemic recovery in transaction activity. As demographic demand has strengthened and fundamentals have improved, capital is returning to the sector. Cap rates have compressed over the past 12 to 18 months, with core independent living assets trading at cap rates near 5.0 to 7.0 percent and assisted living assets generally trading slightly higher than that.36
Transaction Volume39
Senior housing has generated strong long-term performance, producing average annual returns of 8.7 percent since 2006. Returns reached 10.6 percent in 2025, and the sector delivered 3.9 percent in the first quarter of 2026 alone, equivalent to a 16.5 percent annualized pace.37 These results suggest improving operating fundamentals are increasingly being reflected in asset values and investment performance.
Senior Housing Returns38
We believe senior housing offers one of the most compelling opportunities in commercial real estate today, combining accelerating demand, limited supply growth, improving operations, and a capital market that is still in its early stages.
scroll_next
Looking Ahead
Healthcare real estate enters the back half of the decade supported by one of the strongest supply/demand backdrops we have seen in commercial real estate. The oldest baby boomers are now reaching ages associated with the highest levels of healthcare and senior housing utilization, creating a consistent source of demand. At the same time, new supply across both MOBs and senior housing remains constrained by elevated construction and financing costs, along with long development timelines.
The result is a growing demand base colliding with a collapsing supply pipeline. We believe this dynamic creates a compelling foundation for healthcare real estate performance, with senior housing particularly well positioned to benefit as demographic tailwinds accelerate and new inventory remains scarce. Both subsectors are poised for continued growth, supported by strong fundamentals and a supply/demand imbalance. As with most commercial real estate sectors, we expect returns to be driven primarily by income and NOI growth rather than cap rate compression. We believe healthcare’s favorable demand outlook and limited new supply support above-average rent and NOI growth. Over the next five years, we expect both subsectors to rank among the top performers in commercial real estate, with senior housing best positioned.
Co-Authors

scroll_next
1 Worldbank.org Population Estimates, April 2026 Data
2 Centers for Medicare & Medicaid Services, National Health Expenditure Fact Sheet
3 CMS.gov NHE Historical & Projected Data
4 CMS Office of the Actuary, National Health Expenditure Projections 2024–33
5 Federal Reserve DFA
6 https://www.cbo.gov/publication/61570; sum of the estimated outlay lines
7 JLL MOB Fit-Out Cost Guide, 2026
8 JLL 2026 Medical Outpatient Building Perspective
9 American Medical Association. Kane, C.K. (2024). Physician Practice Characteristics in 2024: Private Practices Account for Less Than Half of Physicians in Most Specialties
10 https://www.kaufmanhall.com/news/hospitals-face-2026-newnormal-rising-expenses-and-shifts-revenue-mix
11 Fred: PAYEMS, CES6562000101, CES6562100001, CES6562110001, CES6562140001, CES6562200001. The "healthcare" category, shaded in gray encompasses healthcare sectors not shaded in red within the chart.
12 https://www.kff.org/health-costs/health-policy-101-health-care-costsand-affordability/?entry=table-of-contents-what-factors-contribute-tou-us-health-care-spending
13 JLL MOB Fit-Out Cost Guide, Q4 2025 Data TTM; JLL 2026 Medical Outpatient Building Perspective
14 JLL MOB Fit-Out Cost Guide, 2026; CBRE U.S. MOB Q1 2026 Figures
15 Inland Research Team Assumptions: $605 build cost = JLL’s $412 fit-out benchmark, less $107 of tenant furniture, IT, and moving, + $225 for the shell and + $75 for land; CBRE for Cost PSF Existing; Cap Rate assumptions are purely theoretical
16 JLL 2026 Medical Outpatient Building Perspective
17 CBRE U.S. MOB Q1 2026 Figures
18 JLL MOB Fit-Out Cost Guide, 2026; CBRE U.S. MOB Q1 2026 Figures
19 JLL 2026 Medical Outpatient Building Perspective
20 CBRE U.S. MOB Q1 2026 Figures
21 NCREIF
22 JLL MOB Fit-Out Cost Guide, 2026
23 JLL 2026 Medical Outpatient Building Perspective
24 RevistaMed
25 Green Street U.S. Senior Housing Outlook, January 20, 2026
26 Federal Reserve SCF
27 NIC MAP
28 https://www.nic.org/blog/senior-housing-development-cycles-whenis-the-next-one/
29 National Association of Home Builders. Eye on Housing: Shorter Apartment Construction Time in 2024.
30 NIC MAP; 2025 Senior Housing Outlook Report
31 NIC MAP
32 https://seniorhousingnews.com/2025/07/25/why-senior-living- operators-are-preparing-for-more-staffing-competition-ahead/
33 BLS.gov CES Average Hourly Earnings (NAICS 623312) vs BLS.Gov CPI
(2024= 2.9%, 2025= 2.7%)
34 NCREIF & NIC MAP
35 NIC MAP
36 CBRE Senior Housing Care Survey H2 2025
37 NCREIF
38 NCREIF
39 NIC MAP
scroll_next
Healthcare Sector Review